Hearing loss is amazingly common. One out of eight people over the age of twelve in the United States is hard of hearing. According to the NIH, nearly 25 percent of those aged 65 to 74 and 50 percent of those 75 and older struggle with hearing loss that impairs the activities of daily life.
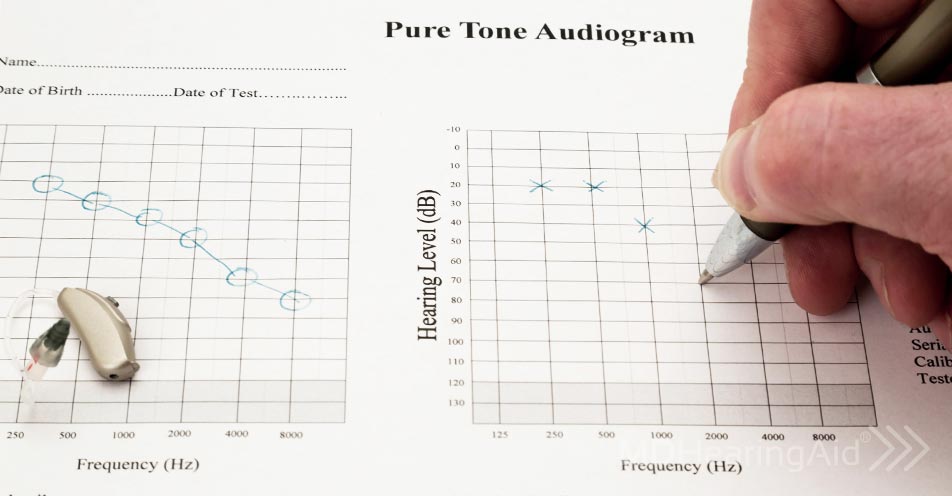
If you’re on Medicare, there’s a good chance you’ve sat in a small soundproof booth to take a hearing test. You’ve listened intently for sounds through headphones with a little button in your hand that you press when you hear a sound.
Have you ever wondered how the audiologist records the results of that test? How do they figure out whether you have normal hearing or hearing loss?
What Is an Audiogram?
Audiologists use an audiogram, a graph that measures frequency (hertz) and loudness (decibels) at different hearing levels from mild to profound. The audiologist marks the intersection of those variables on the graph, which then maps your hearing loss. It sounds simple, but it’s actually a very sophisticated tool that precisely pins down where your hearing loss lies.
The audiogram is key to an effective hearing solution. Once upon a time, all that hearing aids could do was amplify sound. But now, with digital technology, they can be adjusted to your specific level of hearing loss.
Although it is standard practice to review the results of the audiogram, patients may not get to see their audiograms unless they ask for them. Some audiologists assume patients just want the results, not the complete picture. But if you’re struggling with your hearing, or with a loved one’s hearing, you can learn a lot from looking at your own audiogram. This is especially true if you compare audiograms over time, which allows you to establish a baseline and see where your hearing is going.
Having a copy of your audiogram may mean savings as well. Some online providers use your audiogram to program their hearing aids for your hearing loss.
Audiograms Are Not as Complicated as They Look
If you’ve ever seen an audiogram, your eyes may have glazed over trying to figure it out. What do all those X’s and O’s mean anyway? Why are they connected by a line? And why do the lines intersect at some points, and diverge at others?
Audiograms can seem complex, but once you know the basics they’re really pretty simple. If you know the principles of how a graph works—with two intersecting variables—you can understand an audiogram.
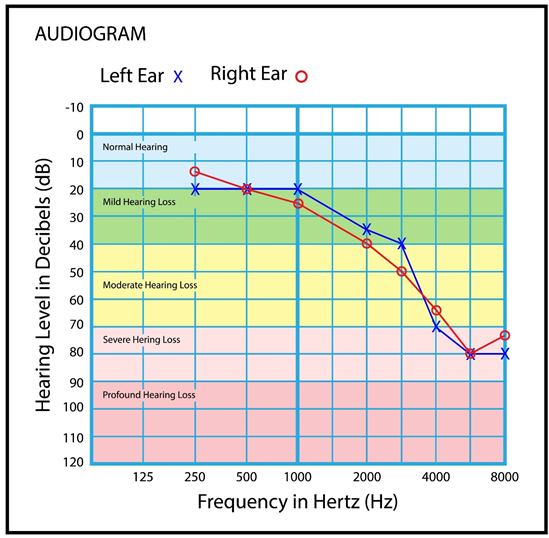
Your audiogram shows the intersection between decibels (loudness) and hertz (frequency or pitch). It shows the softest sounds you can hear at different pitches or frequencies. The closer the marks are to the top of the graph, the better your hearing. The line may be high at one point and dip at another, showing at which frequencies your hearing is better or worse.
For example, the tweeting of a bird is a very high frequency while the growling of a dog is a low frequency. Although they may be equal in loudness, if you have age-related hearing loss—associated with difficulty hearing at high frequencies—you’ll hear the dog but not the bird. Your lines will be higher on the left side of the graph but dip on the right. The audiogram above is an example of this type of hearing loss.
How to Read an Audiogram
Reading from top to bottom, the numbers on the left side of the audiogram list sound intensity, or decibels, which go from 0 decibels at the top to 120 decibels at the bottom. Running from left to right is frequency, or pitch, which is measured in hertz. Frequency starts at the left side with 125 Hertz and goes up to 8,000 Hertz on the right side. This is like a piano keyboard. It has the lowest frequencies on the left and the highest frequencies on the right.
On a typical audiogram, the blue X’s represent the left ear and the red O’s represent the right ear. The X’s and O’s are each connected by a line: one red and one blue. The red line with red O’s represents the hearing in your right ear and the blue line with blue X’s represents your left ear.
If your audiogram lacks colors, the connecting line with the X’s represents your left ear, and the connecting line with the O’s represents your right ear.
What Are Decibels (dB)?
Decibels basically measure loudness.
Although the decibel level on the audiogram starts at 0, it doesn’t mean no sound but rather the least perceptible sound people with normal hearing can hear. 10 decibels is ten times that intensity. Unlike hertz, which are constant numbers, decibels are measured logarithmically. This means a 20 decibel sound is 100 times louder than 0 decibels and so on up the scale.
It’s easier to remember what happens at different decibel levels. According to Dangerous Decibels, a public/private partnership that aims to reduce hearing loss, typical speech is about 60 decibels, a washing machine is 75, and a chainsaw is 115. Listening to noise above 70 dB over a prolonged period of time may start to damage your hearing. Loud noise above 120 dB can cause immediate harm to your ears.
What Is Hertz (Hz)?
Frequency (or pitch) is reported in hertz (Hz), which measures the number of sound vibrations you can hear in one second. A healthy ear can hear a wide range of frequencies, from very low (20 Hz) to very high (20,000 Hz). With hearing loss, the range is narrowed. Age-related hearing loss especially involves losing higher frequencies, such as women’s and children’s voices, while the ability to hear lower voices can be normal.
What Do the Different Levels Actually Mean?
There are five levels of hearing loss—mild, moderate, moderately-severe, severe, and profound—which will be shown on the audiogram.
Normal Hearing
If your hearing is normal, you should see an X or an O that falls into the zero to 20 decibel range for each frequency. That means you can hear the sounds of daily life without amplification.
Mild Hearing Loss
If you have mild hearing loss, you will see the X or O in the 20 to 40 decibel range. Mild hearing loss means you may be having trouble hearing speech in noisy environments. It may also mean you need a higher volume level when watching TV or listening to a stereo. This is why family members are likely to be the first to notice when hearing declines.
Moderate and Moderately-Severe Hearing Loss
Moderate hearing loss will be marked in the 40 to 55 range and moderately-severe in the 55 to 70 range. With moderate to moderately-severe hearing loss, you will frequently have difficulty understanding speech in a noisy environment, including the telephone, television, and at public gatherings. You may find that you’re regularly asking people to repeat themselves and you get frustrated because you are missing what they are saying. People may also tell you that you speak too loudly in conversations.
Severe Hearing Loss
If you have severe hearing loss, the X or O will fall in the 70 to 90 decibel range. This means you have significant difficulty hearing during most types of communications. And you may start avoiding noisy places where you know you will miss much of the conversation.
Profound Hearing Loss
If your hearing loss is profound, you will see the marks in the 90 to 120 decibel range. At this level, you are having major communication problems in all situations. Profound hearing loss typically requires visual assistance such as lip reading or sign language. For both severe and profound hearing loss a cochlear implant may be recommended.
Bone Conduction Testing
Image Source: https://blog.medel.pro
Bone conduction testing is another important part of a complete hearing test and is also recorded on your audiogram.
Sound not only travels in waves through the air to your ear, but the bones in your head also conduct sound. Bone conduction is the same as air conduction except it is done with a bone oscillator—a small square box that sits behind the ear and only stimulates the cochlea—which helps to differentiate problems of the middle or outer ear.
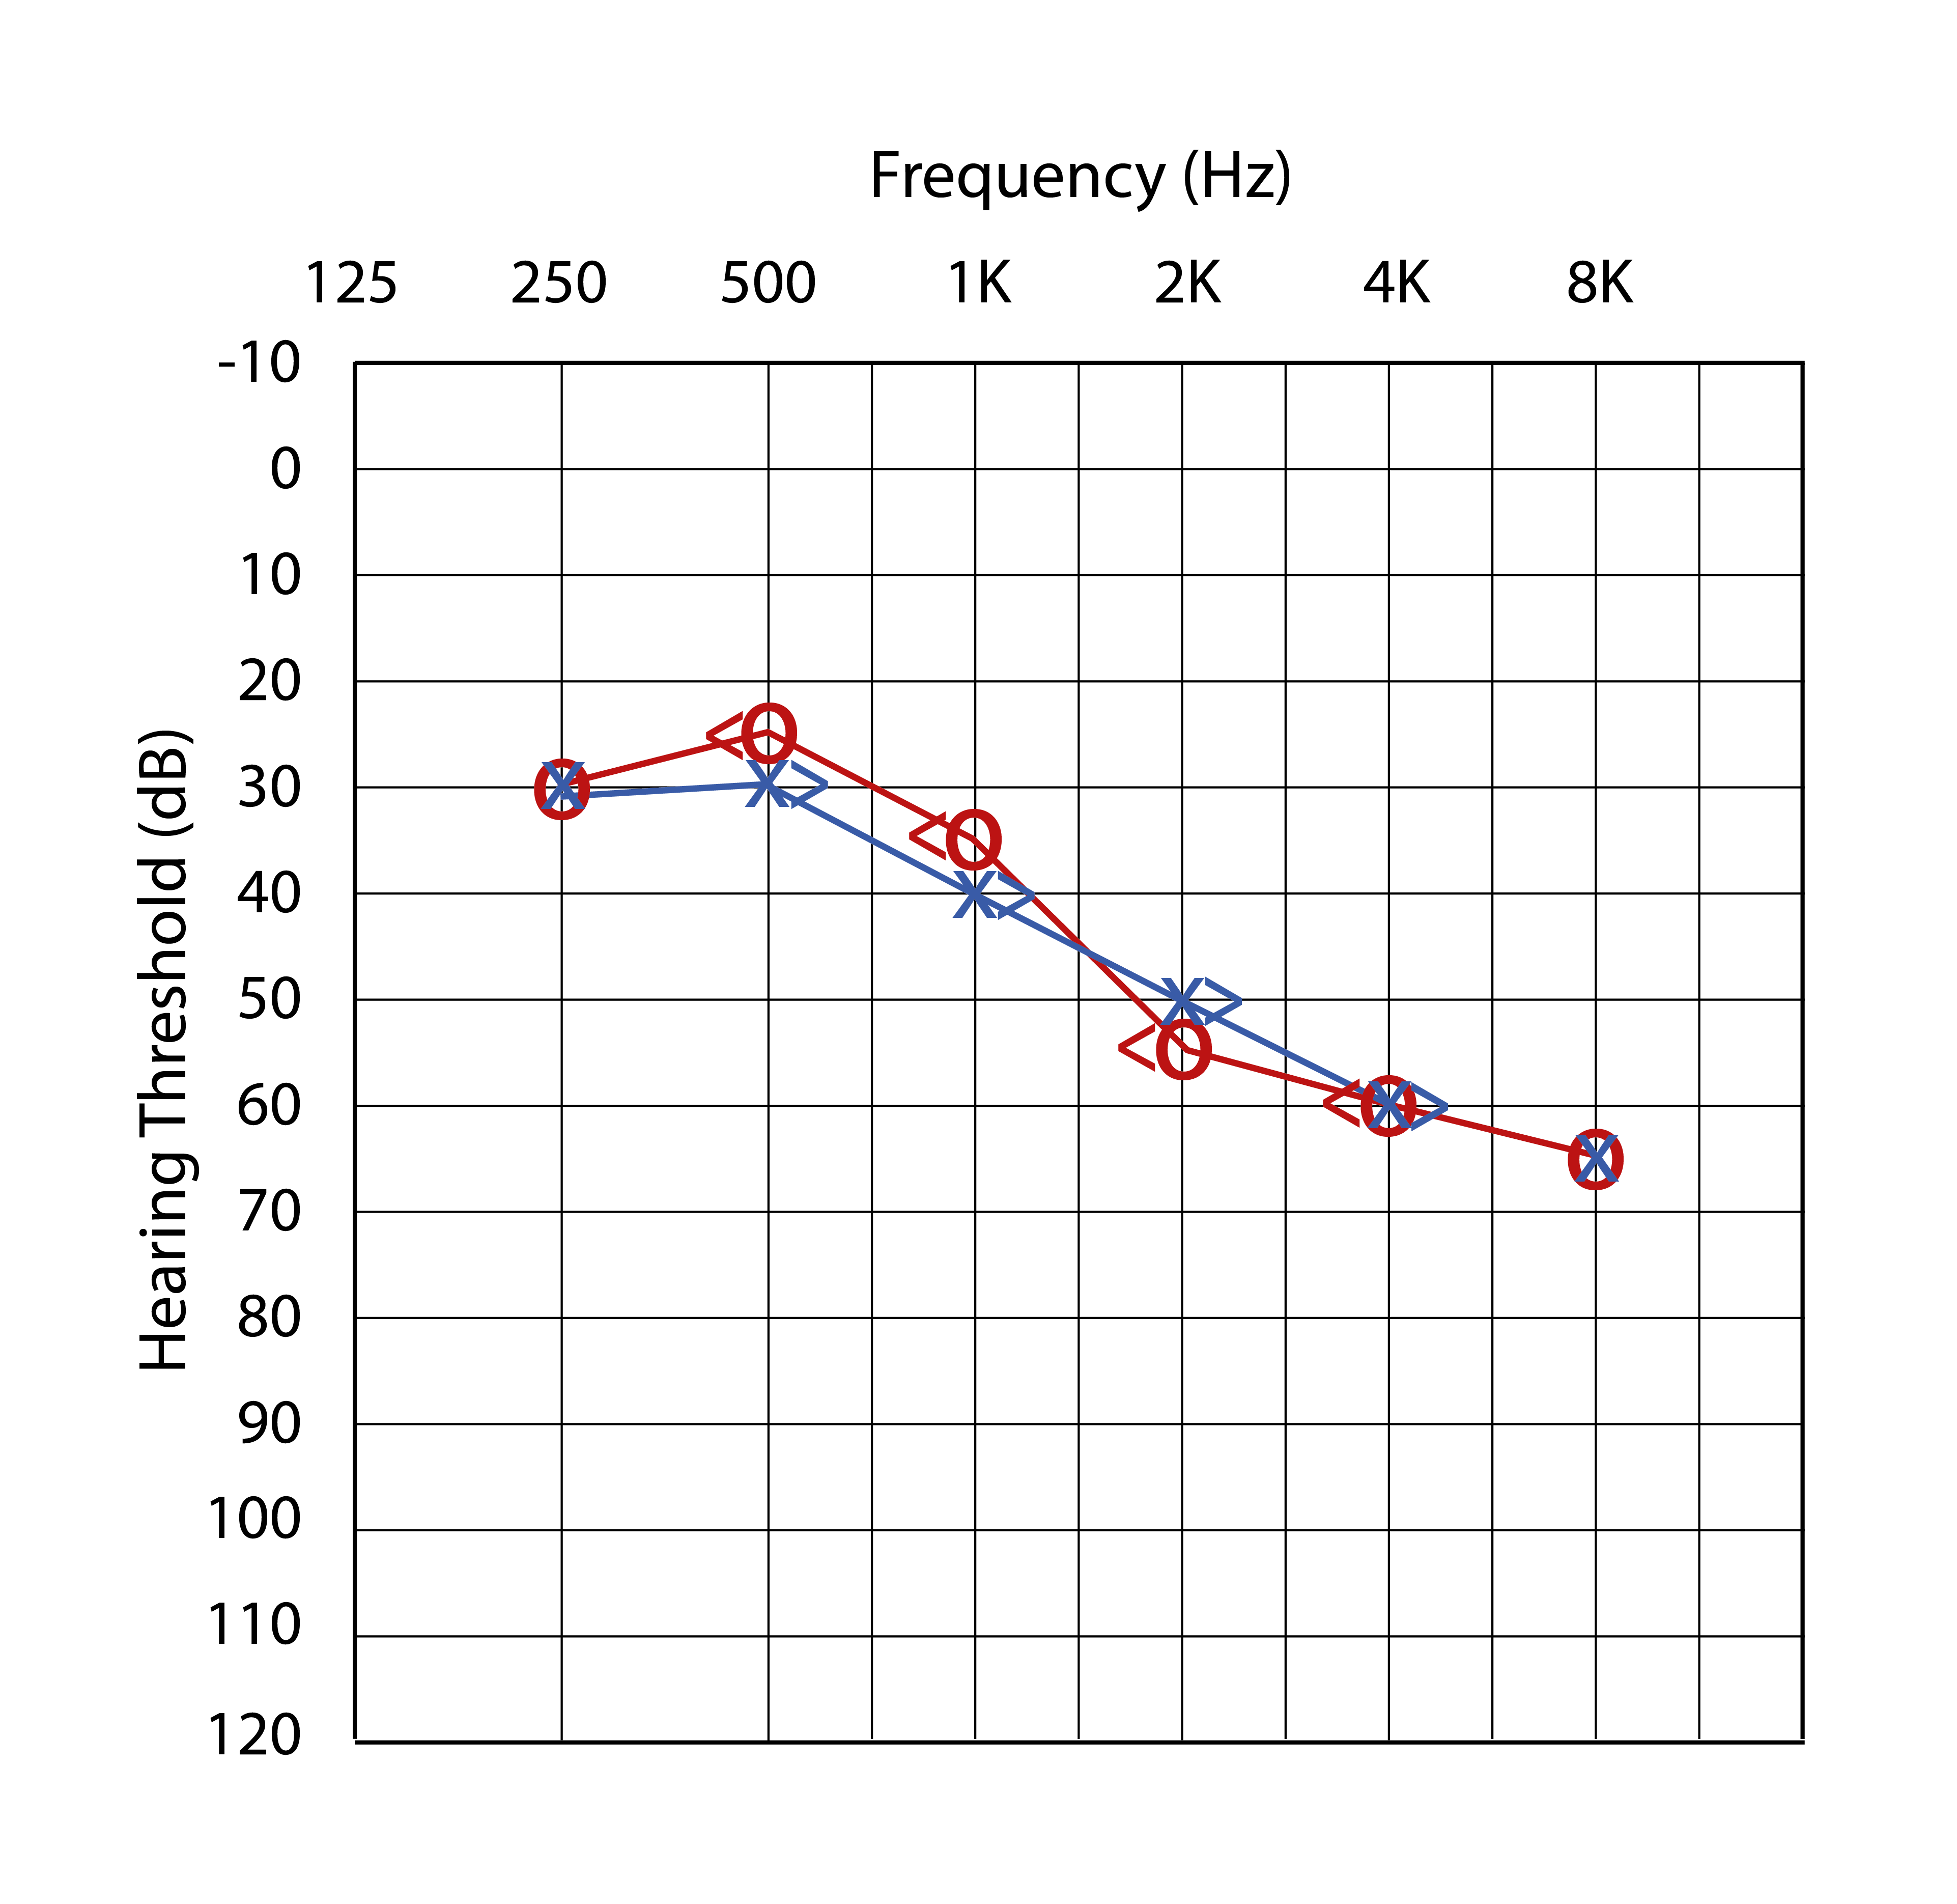
The results of a bone conduction test will be marked using a blue > line for the left ear and a red < line for the right. (see diagram below)
There may be a difference between the air conduction and bone conduction results. This difference is called the air-bone gap. An air-bone gap may mean a problem in the outer or middle ear.
Treating Hearing Loss With Hearing Aids
Hearing solutions can differ widely depending on the individual and type of hearing loss. Once you’ve determined your level of hearing loss, you should start researching the best hearing aid solution for you. When you have an audiogram, your options widen because you can get a hearing aid programmed remotely, which saves a substantial amount of money.
Here is a fact sheet about your hearing test and audiogram that you can refer to for quick questions.
A Hearing Test Is a Good Place To Start
If you have any doubts about your hearing, take a hearing test. Hearing loss is progressive and hearing aids can not only help you hear better, but actually slow the rate of hearing loss. The more you hear, the more the auditory centers of your brain get the input needed to function efficiently.
Why not start by taking this free hearing test from MDHearing? It takes less than 10 minutes to finish and will instantly give you key information about your hearing loss. Another great option is the phone-based hearing screening test from FreeHearingTest.org.
At MDHearing, we’re always available to answer your questions about hearing loss and the various hearing aids available. Our team of specialists can also tell you whether our FDA-registered, affordable hearing care solutions are a good match for your specific needs. Contact us any time, as we really enjoy discussing our products!
Test your hearing now and get your results instantly.
TAKE ONLINE HEARING TEST


